Reports and Interpretation
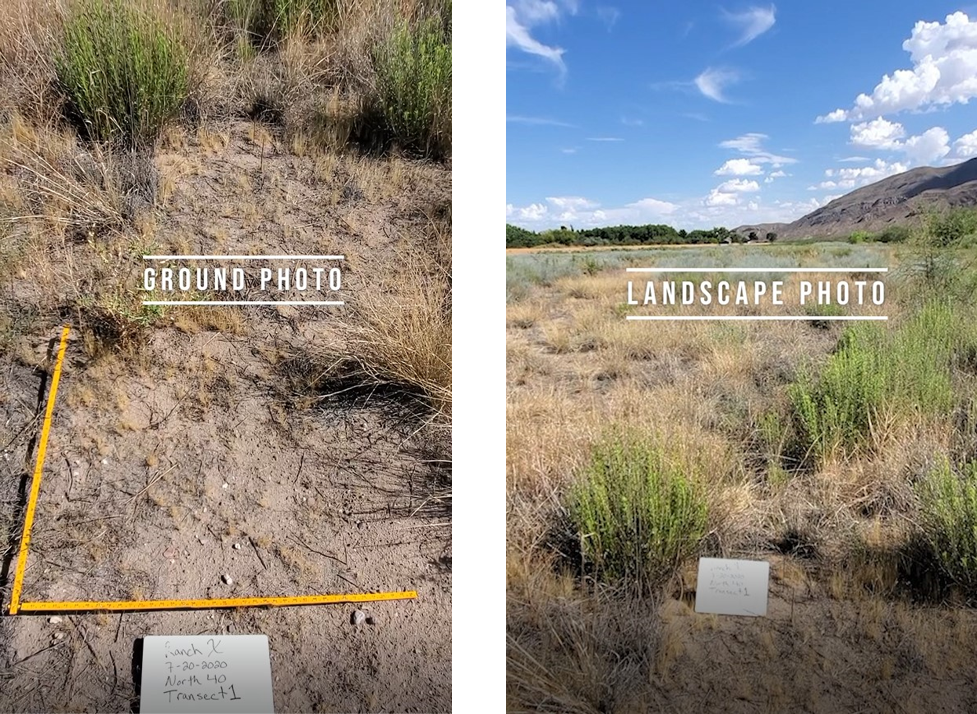
Basic information
- Location data (ranch, pasture, transect, GPS) - Identifies sampling area and enables exact location for future assessments.
- Date - Documents when monitoring occurred; enables trend analysis when multiple years of data are available.
- Collector names - Tracks who performed the assessment; ensures consistency and data integrity.
Site information enable replication - the ability to return to the exact location at the same time of year. This consistency is essential for tracking real changes rather than seasonal variations.
Production Information
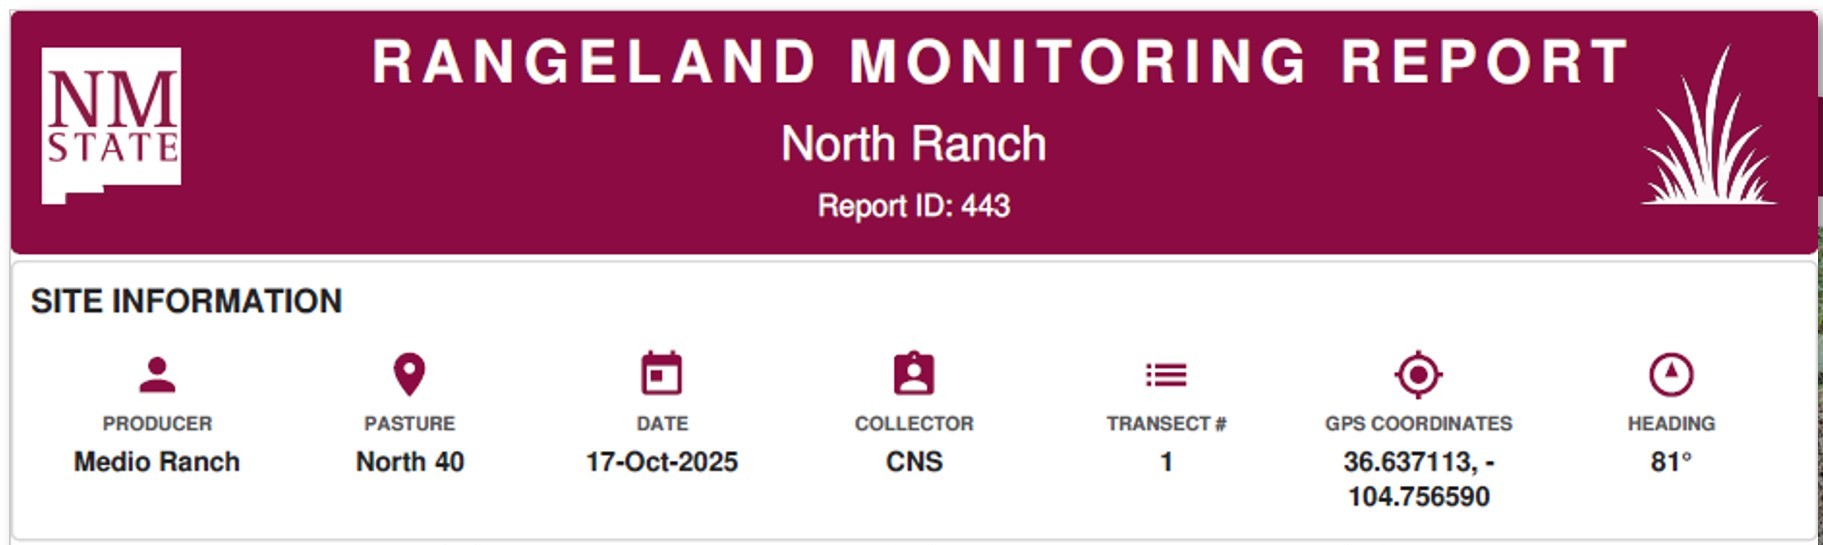
Biomass Availability (or Standing Crop) - Average weight of forage clipped and collected along the transect, expressed as a weight per area.
- Used to assess grazing intensity, evaluate stocking rate appropriateness, and identify livestock distribution issues.
- Can be combined with annual production to calculate percent utilization, guiding grazing management.
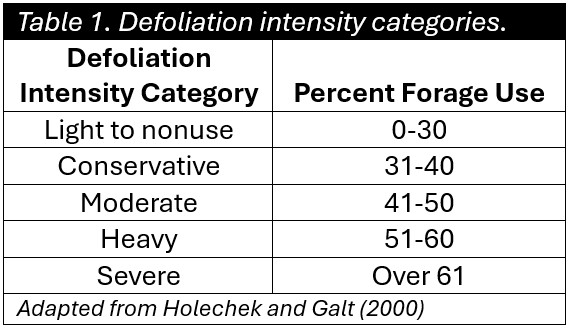
- Conservative use (31-40% utilization) is recommended for arid and semi-arid regions using continuous grazing (Table 1).
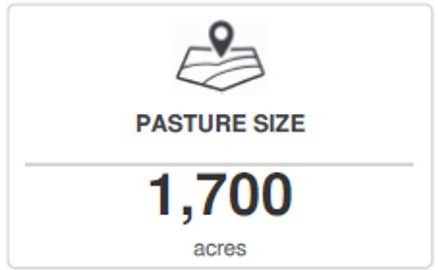
Pasture Size - Total pasture acreage adjusted for slope and distance from water (grazable acres); used to calculate stocking rates.
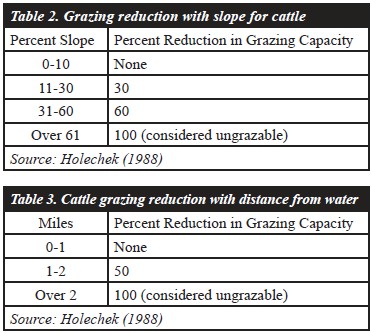
- As distance from water or slope increases, grazable acres decreases (Tables 2 & 3).
- Use the greatest reduction factor, not combined reductions.
- Sample equations:
WATER: (% area <1 mile × 1)+(% area 1-2 miles × 0.5)+(% area 2+ miles × 0) × Total Pasture Size
SLOPE: (% area 0-10% × 1)+( % area 11-30% × 0.6)+( % area 31-60% × 0.3)+( % area >60% × 0)] × Total Pasture Size
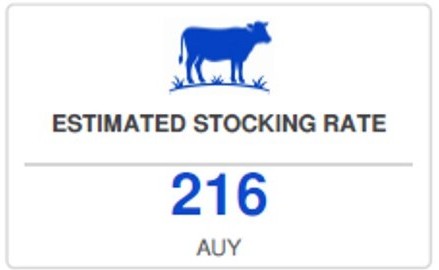
Estimated Stocking Rate - Approximate number of animals the land can support for a given time period while sustaining rangeland conditions
- The calculation is an estimate and may require adjustments based on professional expertise and local conditions
- Sample equation:
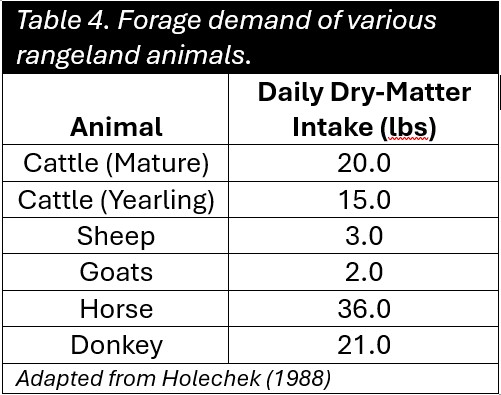
(Annual Forage Production × Pasture Size × Allocated Use) ÷ (Daily Animal Forage Demand × Grazing Duration)
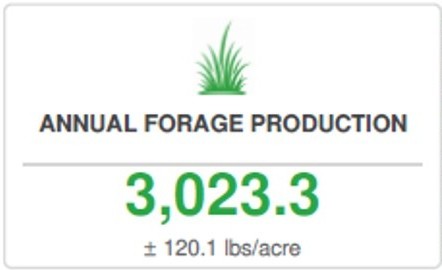
(3023.3 lbs/acre × 1700 acres × 40%) ÷ (26 lbs/day × 365 days) = 216 AUY
Annual Forage Production - Plant material collected from grazing exclusion cages, expressed as a weight per area.
- Estimates total forage production for an entire year without grazing
- Provides baseline productivity data
Percent Cover
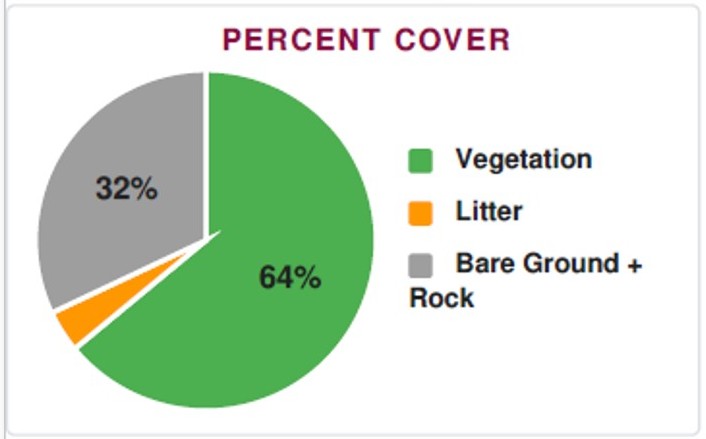
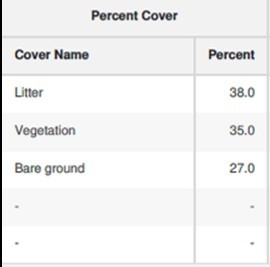
Percent Cover - The proportion of the ground surface covered by vegetation, litter, rocks, bare soil, or other materials (basal cover).
- Used to assess distribution and composition of different material covering the ground.
- Provides valuable information about vegetation density, potential erosion, and likelihood of plant matter being incorporated into the soil.
- Allow land managers to make decisions regarding rangeland conditions or the need to improve an area.
For example:
When the bare ground percentage exceeds 50 percent, erosion potential increases.
Management should focus on increasing or sustaining vegetation and litter percentages to prevent deleterious soil conditions.
Species by Vegetation Cover
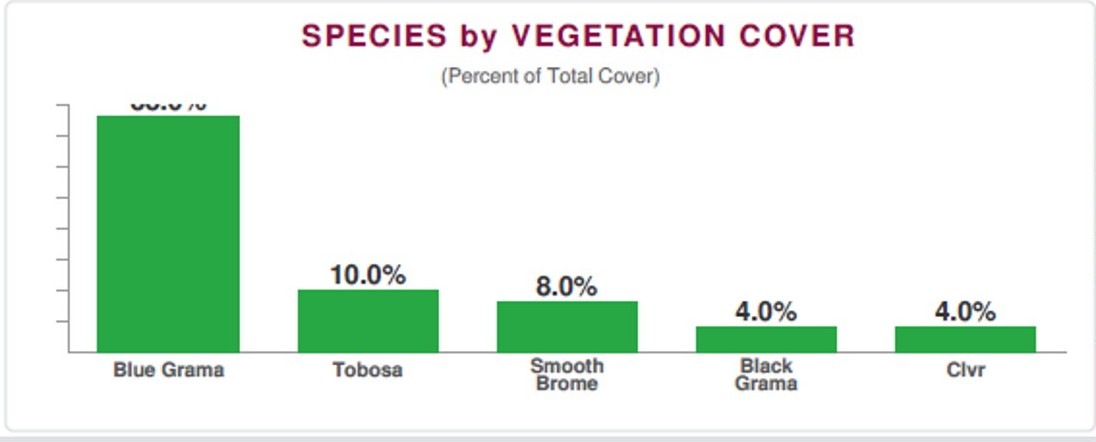
Species by Vegetation Cover - Combined percentage of grasses and non-grass plants from the transect.
- Shows species composition, biodiversity, and forage abundance based on the percentage of vegetation cover readings.
- Provides an inventory of forage species and their respective abundance or frequency within the area.
- Tracks vegetation trends and grazing impacts over time.
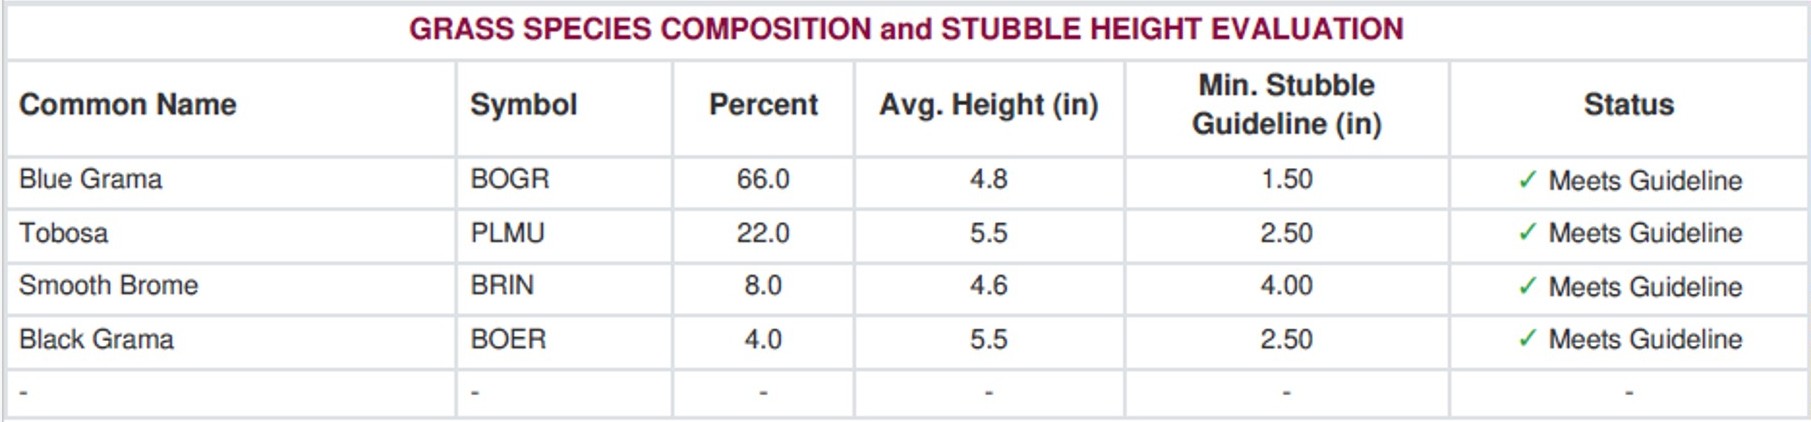
Grass Species Composition & Stubble Height Evaluation
Grass Species Composition - Inventory of all grass species found along the transect (whether or not recorded as vegetation cover).
- Measures grass species diversity, variety, and frequency rather than abundance (as with vegetation cover).
- Shows specific combination and distribution patterns of different species.
- Helps assess the overall grass or forage biodiversity within the plant community.
- Species are listed by their common name, scientific abbreviation (symbol), and frequency percent.
Stubble Height Evaluation - Lists each species height with their minimum grazing height guideline.
- Indicates the amount of forage remaining after grazing
- Heights below the guideline may indicate excessive grazing
- Helps guide animal distribution and grazing management decisions
Fecal Groups and Notes
Fecal Group Counts - Inventory of animal droppings found along the transect; pellets are counted as a group.
- Indicates the relative presence of livestock and wildlife within the monitoring area.
- Changes in fecal group counts over time may suggest changes in relative visitation by a particular species.
- Cannot be used to quantify forage utilization due to unknown factors such as residence time, bedding, travel corridors, defecation rates, and forage quality.
- Should be interpreted alongside forage production and utilization measurements to support management decisions.
Notes - Allows for recording of observations that may be of importance, not measured along the transect.
- Helps to record any additional information that may be occurring such as rodents, invasive species, or erosion issues not quantified in the report.

Photos
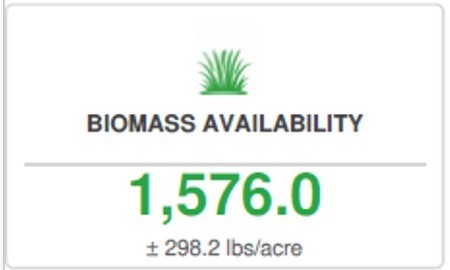
- A qualitative assessment to support quantitative assessments.
- An illustrative record of the conditions that occurred at a given point in time.
Ground Photo - When accompanied with a scaled ruler can be used to quantify cover or species composition.
Landscape Photo - Used to demonstrate grazing intensity when used in conjunction with quantitative data.